National Influenza Vaccine Data
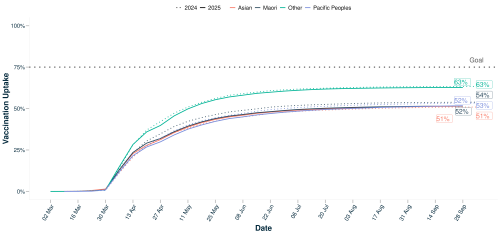
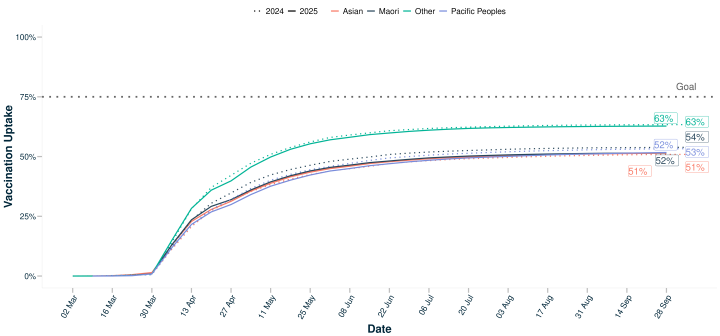
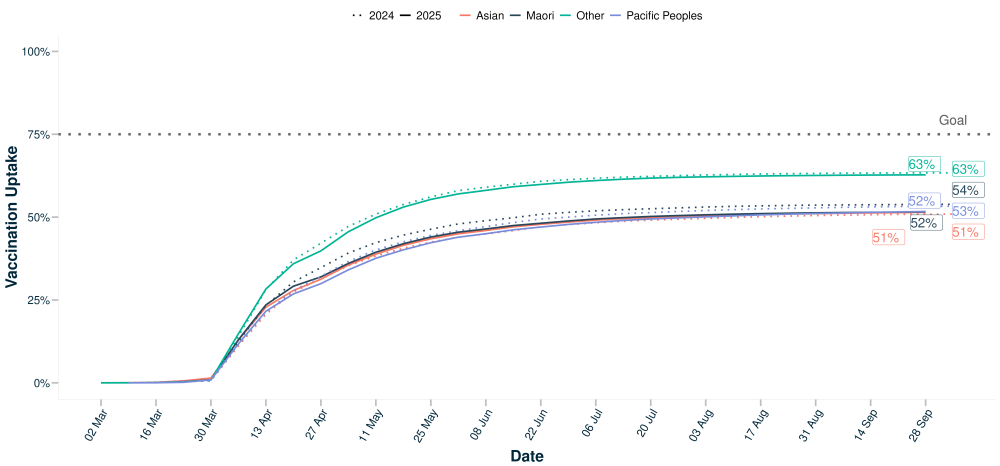
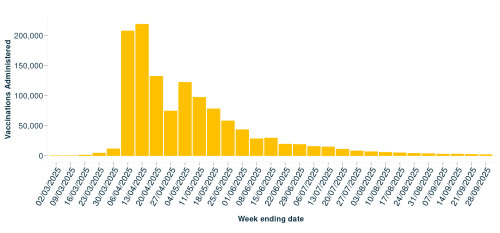
Data and statistics about the rollout of the 2025 flu vaccine campaign in New Zealand.
This page is updated weekly at 1 pm on Thursday. Vaccine data is up to 28 September 2025. Please note the final update to the content of this page will be made once the flu season had ended for the year, typically end of September.