COVID-19: Current cases
Read the latest information about cases of COVID-19 in New Zealand.
This data is updated weekly. All data on this page relates to cases recorded prior to 11:59pm 29 June 2025.
Last updated 2pm 30 June 2025.
This data is updated weekly. All data on this page relates to cases recorded prior to 11:59 pm 29 June 2025.
|
New case average* |
RATs uploaded average* |
|
129 ↑ |
236 ↑ |
|
Cases in hospital as at midnight Sunday |
Cases in ICU as at midnight Sunday |
|
77 |
** |
|
Deaths attributed to COVID* |
Total deaths attributed COVID |
|
2 ↑ |
4,691 |
* 7 day rolling average
** Not available
Summary
| In the last week | New cases reported | 1068 |
|---|---|---|
| Reinfections | 709 | |
| Reinfections (< 90 days) | 2 | |
| Total since first New Zealand case | Cases reported | 2730919 |
| Reinfections | 424654 | |
| Reinfections (< 90 days) | 27163 |
Case outcomes since first New Zealand case
| COVID-19 cases | Change in the last week | Total |
|---|---|---|
| Recovered | 881 | 2725327 |
| Deceased* | 13 | 4691* |
*The Ministry of Health has recently switched its definition of 'deceased' from deaths within 28 days of testing positive for COVID-19 to deaths attributed to COVID-19. See the definitions section below for further details.
| Cause of death | Died within 28 days of positive test | Died more than 28 days after positive test | Total | Change in the last week |
|---|---|---|---|---|
| COVID as underlying | 2759 | 192 | 2951 | 10 |
| COVID as contributory | 1587 | 153 | 1740 | 3 |
| COVID-attributed total | 4346 | 345 | 4691 | 13 |
| Not COVID | 2342 | 0* | 2342 | 10 |
| Not available | 277 | 0 | 277 | -2 |
| Total | 6965 | 345 | 7310 | 21* |
*The change in total deaths with COVID may not be equal to the number of new deaths reported today. This is because deaths that occurred more than 28 days after a positive test that are subsequently determined to be unrelated to COVID are removed from the total.
Of the 21 people whose deaths we are reporting today: eight were from Auckland region, three were from Waikato, two were from Bay of Plenty, one was from Taranaki, one was from Whanganui, one was from Wellington region, one was from Canterbury, one was from West Coast, three were from Southern.
Three were in their 40s, four were in their 60s, three were in their 70s, six were in their 80s and five were aged over 90. Of these people, nine were women and 12 were men.
Number of active cases
| Change in the last week | Total since first NZ case | |
|---|---|---|
| Confirmed | 1068 | 2684344 |
| Probable | 0 | 46575 |
| Total | 1068* | 2730919 |
*The change in total case numbers may not be equal to the number of new cases reported today due to data updating and reconciliation.
| Active case - confirmed |
Confirmed cases are people who have received a positive PCR test OR someone who has received a positive result on a Rapid Antigen Test. |
|---|---|
| Active case - probable | A probable case is when someone is diagnosed based on their exposure to other people with COVID-19 and on their symptoms. |
| Reinfections | Reinfections are cases in an individual who reported a case 29 or more days previously. |
| Recovered | Recovered cases are people who had the virus, where at least 7 days have passed since their symptoms started and they have not had symptoms for 72 hours, and they have been cleared by the health professional responsible for their monitoring. |
| Deceased | Includes all deaths where COVID-19 is determined to have been the underlying cause of death or a contributory cause of death. |
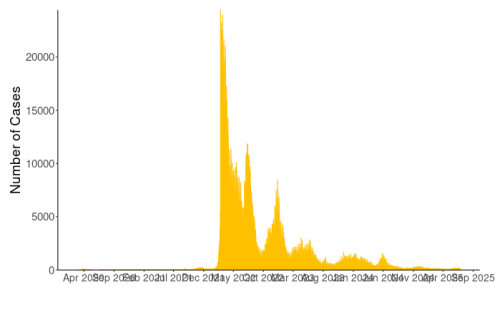

This graph shows the count of all cases of COVID-19 every day (all cases – confirmed and probable) since the first New Zealand case in late February 2020. The graph shows the rapid increase of daily cases from mid-February 2022 to early March 2022, driven by the Omicron variant.
From mid-March to mid-April 2022, cases rapidly declined, followed by a period of slower decline until early July. This was followed by a rapid increase in cases, peaking in August before a steady decline in new daily cases. Reported new daily cases hit their lowest since February 2022 in September 2022.
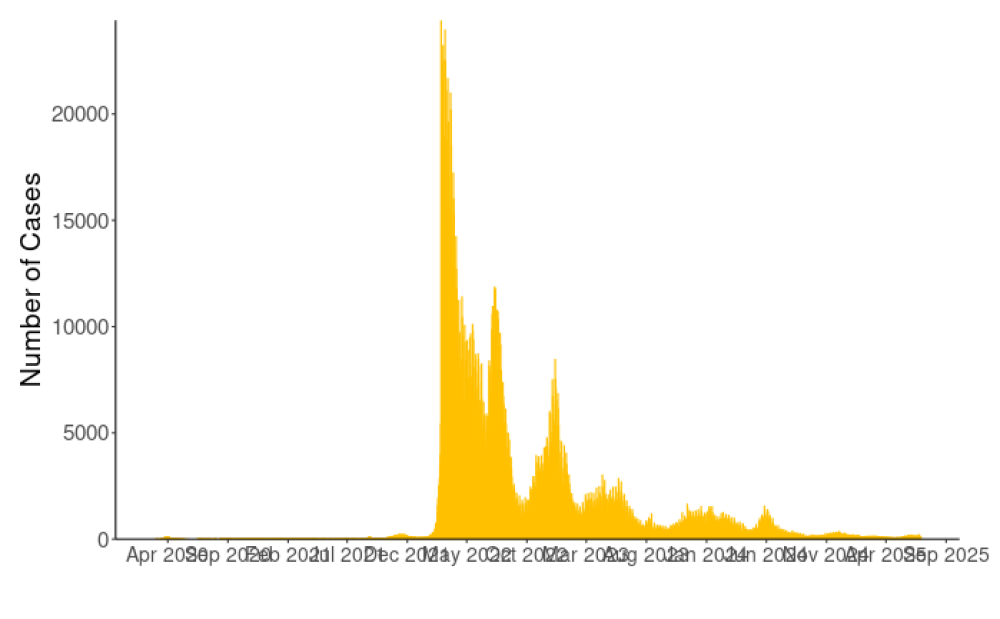


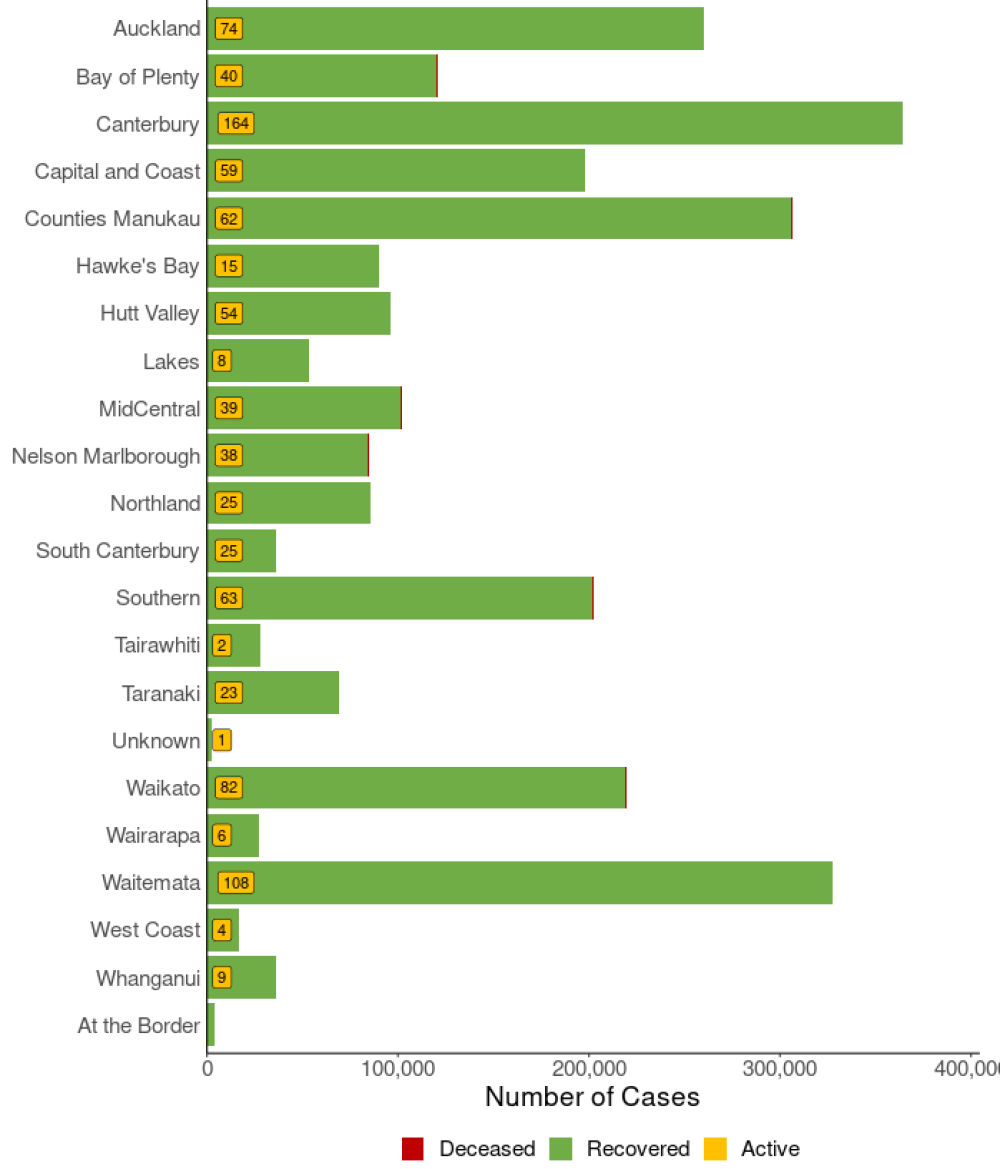
This bar graph shows the total cases and their status by health district and those with recent travel history.
The ‘At the border’ data group includes cases detected in managed isolation or quarantine facilities from the period when these were operating, as well as cases with recent travel history from after that time. They are not included in the district totals. Before 17 June, people in managed isolation or quarantine facilities were included in the total of the relevant district.
|
Location |
Active |
Recovered |
Deceased |
Total |
New cases in the last week |
|---|---|---|---|---|---|
| Auckland | 74 | 259962 | 336 | 260372 | 92 |
| Bay of Plenty | 40 | 120290 | 225 | 120555 | 48 |
| Canterbury | 164 | 363756 | 618 | 364538 | 182 |
| Capital and Coast | 59 | 197715 | 212 | 197986 | 68 |
| Counties Manukau | 62 | 305901 | 366 | 306329 | 97 |
| Hawke's Bay | 15 | 89788 | 194 | 89997 | 18 |
| Hutt Valley | 54 | 96100 | 109 | 96263 | 61 |
| Lakes | 8 | 53302 | 123 | 53433 | 12 |
| Mid Central | 39 | 101683 | 246 | 101968 | 45 |
| Nelson Marlborough | 38 | 84315 | 198 | 84551 | 44 |
| Northland | 25 | 85489 | 178 | 85692 | 31 |
| South Canterbury | 25 | 36476 | 59 | 36560 | 38 |
| Southern | 63 | 201591 | 455 | 202109 | 79 |
| Tairāwhiti | 2 | 27773 | 51 | 27826 | 2 |
| Taranaki | 23 | 68821 | 154 | 68998 | 23 |
| Unknown | 1 | 2457 | 9 | 2467 | 1 |
| Waikato | 82 | 218915 | 476 | 219473 | 90 |
| Wairarapa | 6 | 27131 | 74 | 27211 | 6 |
| Waitematā | 108 | 327119 | 497 | 327724 | 118 |
| West Coast | 4 | 16498 | 24 | 16526 | 4 |
| Whanganui | 9 | 36116 | 82 | 36207 | 9 |
| At the Border* | 0 | 4129 | 5 | 4134 | 0 |
| Total | 901 | 2725327 | 4691 | 2730919 | 1068 |
*Due to retiring the COVID-19 Protection Framework on 12 September 2022, the Ministry of Health no longer separately reports COVID-19 cases who have recently travelled overseas. These cases will be included in the weekly reporting on all COVID-19 community cases, but we will no longer distinguish between border and other cases.
You can also view a detailed breakdown of daily case numbers for each district since the beginning of the pandemic here:
New Zealand COVID-19 data - Ministry of Health (external link)
Note: we cannot give detailed information about cases in your district, city or town, as we must protect the privacy of the people concerned.