Testing for COVID-19
Information on lab testing and capacity and testing rates by ethnicity and district.
This data is updated weekly. All data on this page relates to tests recorded prior to 11:59 pm 5 May 2024.
Last updated 2pm 6 May 2024.
This data is updated weekly. All data on this page relates to tests recorded prior to 11:59pm 5 May 2024.
Testing data is collected from the Eclair database (administered by ESR) unless otherwise stated.
COVID-19 testing
| Total | |
|---|---|
| PCR tests uploaded during past week | 4,850 |
| All COVID-19 viral tests administered | 8,210,055 |
| Testing kits in stock | 22,373 |
| Test results | In managed facilities | Within NZ communities | Total |
|---|---|---|---|
| Tested positive for COVID-19 | 3,838 | 249,833 | 253,671 |
| Tested negative (no COVID-19) | 236,841 | 7,665,718 | 7,902,559 |
| Inconclusive result for COVID-19 | 190 | 53,635 | 53,825 |
| Total (all tests) | 240,869 | 7,969,186 | 8,210,055 |

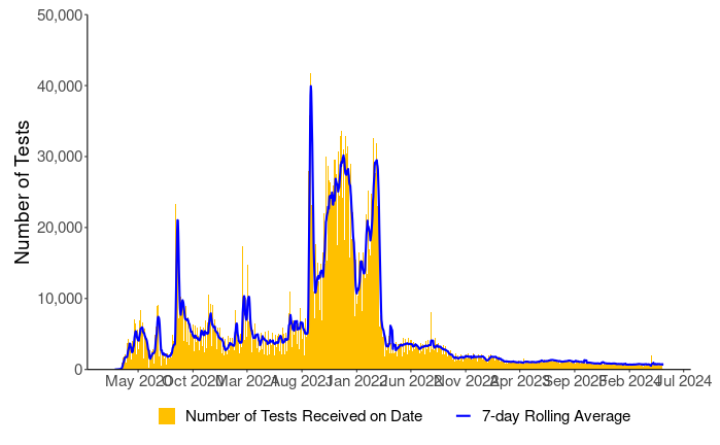

Daily number of tests completed for COVID-19 (with seven-day rolling average)
Daily number of tests completed for COVID-19 (with seven-day rolling average)
Tests at managed facilities and within the community in health districts
| Health district of residence | 9 Apr to 14 Apr | 16 Apr to 21 Apr | 23 Apr to 28 Apr | 30 Apr to 5 May |
|---|---|---|---|---|
| Auckland | 465 | 520 | 497 | 429 |
| Bay of Plenty | 153 | 176 | 140 | 160 |
| Canterbury/West Coast | 548 | 677 | 618 | 463 |
| Capital & Coast/Hutt | 303 | 292 | 279 | 286 |
| Counties Manukau | 897 | 712 | 699 | 699 |
| Hawkes Bay | 165 | 134 | 112 | 185 |
| Lakes | 73 | 65 | 51 | 60 |
| MidCentral | 110 | 105 | 93 | 104 |
| Nelson Marlborough | 120 | 121 | 115 | 158 |
| Northland | 240 | 234 | 201 | 192 |
| South Canterbury | 21 | 24 | 20 | 6 |
| Southern | 347 | 389 | 390 | 316 |
| Tairawhiti | 15 | 17 | 7 | 25 |
| Taranaki | 139 | 146 | 152 | 163 |
| Waikato | 546 | 563 | 506 | 503 |
| Wairarapa | 44 | 57 | 52 | 63 |
| Waitemata | 1,259 | 1,045 | 1,018 | 978 |
| Whanganui | 18 | 22 | 24 | 13 |
| Unknown | 80 | 37 | 43 | 47 |
| Total | 5,543 | 5,336 | 5,017 | 4,850 |
Note: some people are tested more than once. We cannot give you detailed information about tests in your district, city or town, as we must protect the privacy of the people concerned.
| Ethnicity | 9 Apr to 14 Apr | 16 Apr to 21 Apr | 23 Apr to 28 Apr | 30 Apr to 5 May |
|---|---|---|---|---|
| Māori | 1,039 | 976 | 913 | 901 |
| Pacific Peoples | 710 | 658 | 631 | 589 |
| Asian | 644 | 620 | 624 | 615 |
| European or Other | 3,097 | 3,058 | 2,822 | 2,703 |
| Unknown | 53 | 24 | 27 | 42 |
| Total | 5,543 | 5,336 | 5,017 | 4,850 |
| COVID-19 test result | 9 Apr to 14 Apr | 16 Apr to 21 Apr | 23 Apr to 28 Apr | 30 Apr to 5 May |
|---|---|---|---|---|
| Tested positive | 442 | 396 | 367 | 394 |
| Tested negative (no COVID-19) | 5,089 | 4,926 | 4,642 | 4,449 |
| Inconclusive result | 12 | 14 | 8 | 7 |
| Total | 5,543 | 5,336 | 5,017 | 4,850 |
All tests by district and in managed isolation and quarantine facilities from 22 January 2020 to 6 May 2024
| Age group | Total people tested | Tested positive (%) | Test rate per 1000 people |
|---|---|---|---|
| 0 to 9 | 576,775 | 3.67% | 883.0 |
| 10 to 19 | 680,178 | 3.81% | 1,061.8 |
| 20 to 29 | 1,498,515 | 2.71% | 2,222.6 |
| 30 to 39 | 1,531,056 | 2.46% | 2,221.9 |
| 40 to 49 | 1,183,927 | 2.34% | 1,887.0 |
| 50 to 59 | 1,176,369 | 2.35% | 1,838.8 |
| 60 to 69 | 850,562 | 2.94% | 1,590.6 |
| 70 to 79 | 425,088 | 5.24% | 1,187.0 |
| 80+ | 284,014 | 8.96% | 1,549.2 |
| Unknown | 3,571 | 9.91% | NA |
| Total | 8,210,055 | 3.09% | 1,641.8 |
| Location | Total tests | Tested positive (%) | Test rate per 1000 people |
|---|---|---|---|
| Managed isolation and quarantine facilities | 240,869 | 1.59% | NA |
| Auckland | 1,171,797 | 2.95% | 2,381.2 |
| Bay of Plenty | 294,133 | 2.68% | 1,135.0 |
| Canterbury/West Coast | 645,820 | 4.22% | 1,078.9 |
| Capital & Coast/Hutt | 515,132 | 3.15% | 1,094.4 |
| Counties Manukau | 1,544,474 | 3.44% | 2,607.0 |
| Hawkes Bay | 146,740 | 2.68% | 840.9 |
| Lakes | 130,760 | 2.12% | 1,142.7 |
| MidCentral | 142,685 | 3.18% | 784.9 |
| Nelson Marlborough | 143,446 | 3.25% | 910.6 |
| Northland | 271,292 | 2.22% | 1,402.3 |
| South Canterbury | 40,347 | 2.95% | 659.0 |
| Southern | 368,305 | 4.60% | 1,098.6 |
| Tairawhiti | 35,520 | 2.47% | 690.5 |
| Taranaki | 148,919 | 3.11% | 1,209.9 |
| Waikato | 685,115 | 3.02% | 1,592.2 |
| Wairarapa | 39,752 | 3.17% | 817.6 |
| Waitemata | 1,355,871 | 2.71% | 2,155.1 |
| Whanganui | 38,696 | 3.09% | 567.0 |
| Unknown | 250,382 | 2.14% | NA |
| Total | 8,210,055 | 3.09% | 1,641.8 |
Tests by ethnicity from 22 January 2020 to 5 May 2024
| Ethnicity* | Total test | Tested positive (%) | Test rate per 1000 people |
|---|---|---|---|
| Māori | 1,224,291 | 3.08% | 1,596.9 |
| Pacific Peoples | 957,836 | 5.02% | 2,603.5 |
| Asian | 1,340,031 | 2.88% | 1,823.9 |
| European or Other | 4,315,392 | 2.85% | 1,388.3 |
| Unknown | 372,505 | 1.66% | NA |
| Total | 8,210,055 | 3.09% | 1,641.8 |
* The prioritised ethnicity classification system is used in this table and below. This means each person is allocated to a single ethnic group, based on the ethnic groups they identify with. Where people identify with more than one group, they are assigned in this order of priority: Māori, Pacific Peoples, Asian, and European/Other. So, if a person identifies as being Māori and New Zealand European, the person is counted as Māori. See Ngā tapuae me ngā raraunga: Methods and data sources for further information.
The data categorized by ethnicity come from National Health Index (NHI) data collection, linked to data held in the EpiSurv database.
Testing rates per 1000 people by location and ethnicity from 22 January 2020 to 5 May 2024
| Location | Māori | Pacific peoples | Asian | European/Other |
|---|---|---|---|---|
| Auckland | 3.24% | 5.15% | 2.75% | 2.49% |
| Bay of Plenty | 2.79% | 4.35% | 3.22% | 2.48% |
| Canterbury/West Coast | 3.92% | 5.61% | 3.32% | 4.44% |
| Capital & Coast/Hutt | 3.05% | 4.90% | 2.93% | 3.00% |
| Counties Manukau | 3.37% | 5.31% | 2.71% | 2.09% |
| Hawkes Bay | 2.46% | 3.02% | 3.38% | 2.70% |
| Lakes | 2.09% | 2.92% | 1.64% | 2.19% |
| MidCentral | 2.69% | 5.34% | 2.88% | 3.27% |
| Nelson Marlborough | 3.19% | 4.58% | 4.58% | 3.13% |
| Northland | 2.32% | 2.62% | 1.99% | 2.15% |
| South Canterbury | 2.40% | 3.87% | 2.76% | 3.03% |
| Southern | 4.12% | 5.09% | 5.47% | 4.56% |
| Tairawhiti | 2.15% | 4.14% | 1.68% | 2.85% |
| Taranaki | 3.35% | 3.87% | 3.23% | 3.03% |
| Waikato | 3.41% | 5.21% | 3.69% | 2.58% |
| Wairarapa | 3.07% | 4.07% | 3.33% | 3.17% |
| Waitemata | 3.02% | 4.53% | 2.72% | 2.36% |
| Whanganui | 3.25% | 4.66% | 1.96% | 3.05% |
Note: some people are tested more than once. We cannot give you detailed information about tests in your district, city or town, as we must protect the privacy of the people concerned.
Percentage of tests returning a positive result by district and ethnicity from 22 January 2020 to 5 May 2024
| Location | Māori | Pacific peoples | Asian | European/Other |
|---|---|---|---|---|
| Auckland | 3.23% | 5.15% | 2.75% | 2.48% |
| Bay of Plenty | 2.80% | 4.34% | 3.22% | 2.48% |
| Canterbury/West Coast | 3.92% | 5.61% | 3.33% | 4.44% |
| Capital & Coast/Hutt | 3.04% | 4.90% | 2.92% | 3.00% |
| Counties Manukau | 3.37% | 5.31% | 2.71% | 2.09% |
| Hawkes Bay | 2.45% | 3.03% | 3.39% | 2.68% |
| Lakes | 2.10% | 2.93% | 1.62% | 2.19% |
| MidCentral | 2.68% | 5.31% | 2.86% | 3.26% |
| Nelson Marlborough | 3.16% | 4.61% | 4.57% | 3.12% |
| Northland | 2.32% | 2.62% | 1.98% | 2.14% |
| South Canterbury | 2.41% | 3.86% | 2.76% | 3.02% |
| Southern | 4.12% | 5.08% | 5.48% | 4.55% |
| Tairawhiti | 2.14% | 4.15% | 1.70% | 2.87% |
| Taranaki | 3.34% | 3.88% | 3.26% | 3.03% |
| Waikato | 3.40% | 5.22% | 3.69% | 2.57% |
| Wairarapa | 3.05% | 4.10% | 3.33% | 3.15% |
| Waitemata | 3.01% | 4.53% | 2.72% | 2.36% |
| Whanganui | 3.26% | 4.73% | 1.96% | 3.04% |
Note: we cannot give the total number of people testing positive per district and ethnicity for privacy reasons.
Tests by age group from 22 January 2020 to 5 May 2024
| Age group | Total people tested | Tested positive (%) | Test rate per 1000 people |
|---|---|---|---|
| 0 to 9 | 575,698 | 3.66% | 881.3 |
| 10 to 19 | 679,944 | 3.81% | 1,061.4 |
| 20 to 29 | 1,498,169 | 2.70% | 2,222.1 |
| 30 to 39 | 1,530,623 | 2.46% | 2,221.2 |
| 40 to 49 | 1,183,579 | 2.34% | 1,886.4 |
| 50 to 59 | 1,175,881 | 2.35% | 1,838.0 |
| 60 to 69 | 849,898 | 2.94% | 1,589.3 |
| 70 to 79 | 424,309 | 5.23% | 1,184.8 |
| 80+ | 282,995 | 8.95% | 1,543.7 |
| Unknown | 3,550 | 9.86% | NA |
| Total | 8,204,646 | 3.09% | 1,640.8 |
Tests by sex from 22 January 2020 to 5 May 2024
| Sex | Total people tested | Tested positive (%) | Test rate per 1000 people |
|---|---|---|---|
| Female | 4,010,567 | 3.17% | 1,572.8 |
| Male | 3,942,529 | 3.09% | 1,610.1 |
| Unknown | 251,550 | 1.80% | NA |
| Total | 8,204,646 | 3.09% | 1,640.8 |
Note: On 4 January 2022, the Ministry of Health started reporting testing rates using the Ministry's HSU population estimate.